Introduction
Course registration is a stressful time for students at Penn. Whether it's trying to strike the balance between work load, difficulty, and quality, or weighing the probabilities of getting into a course when ranking them, students spend needless hours stressing over issues around registration rather than their academics. I hope this analysis provides you insights around student reviews and demands around courses at Penn and maybe even ease your selection and registration processes.
Sources
There are two datasets in this project: Penn Course Review and Penn Course Alert data sets. The Penn Course Review data was pulled from the Penn Course Review API. As a member of Penn Labs, I was able to get access to the Penn Course Alert data, which consists of data from requests made by students through the PCA service.
Penn Course Review data provides insights on a course, listed by semester, year, and professor, through reviews and ratings provided by students at the end of the semester. The API returns a JSON that consists of this information.
Penn Course Alert provides a notification service to students regarding when a closed course becomes available.
Students sign up to get notified via text or email. The data PCA collects is the number of times students
request to get notified for a specific course. This can be used as a proxy for how in-demand a course is.
Added to the PCA data to help with the visualization was a table of departments by school. I collected this data
through Penn's academic curriculum portion of their website. I copy and pasted these values into a table in my
PCA data set to then use a VLOOKUP to correspond departments to schools for each course.
Project
Introduction
As a student at Penn, I wanted to get a deeper understanding of what makes a course "hot", and therefore
becomes in such high demand that students are still trying to get in post advanced registration. Through the
two data sets I have, I wanted to dive deeper into what these courses are, what drives their demand, and hopefully
provide some conclusions that will be insightful for future course selection processes.
My initial hypothesis is that courses that are ranked very low in course work or
difficulty, courses taught by highly ranked professors, low capacity, are core courses, or courses with high quality will
surface as the courses students make requests through PCA for.
The data used in this analysis is 2018 Spring PCA data and 2016 Spring PCR data (the last time PCR was updated). I wanted to
match the semesters as best as possible and aimed to select data from similar semesters.
Collecting & Cleaning
The dataset was a bit tricky to collect and clean. First, I identified the courses that students made requests
for as the sample I wanted to focus on. After getting that data from MongoDB using mongodump and converting BSON to JSON,
I cleaned the course queries since there wasn't sufficient error handling in the form (some queries produced incorrect
course codes that would result in an error when using that to pull PCR data). Furthermore, I used a pivot table
to aggregate course sections into one count value per course.
Then, I loaded the course identifiers
into an array for which I wrote a script that pulled data for each one of the courses listed in PCA (script can
be found on my Github). From there, I converted my JSON
file into a CSV file, for which I was able to clean and parse through using Excel and combine with the PCA data.
Once the data was well structured, I loaded it into Tableau with an inner join on course code, and created visualizations that best surfaced reasons behind highly demanded courses.
About the Data
Penn Course Review Data
| Field | |
|---|---|
Course |
Course code without section |
Instructor Name |
Instructor's full name |
Num Reviewers |
Course code without section |
Num Reviewers |
Number of students that opted in to review the course |
Num Students |
Number of students in the course |
Amount Learned Comm Ability
Course Quality Difficulty Instructor Access
Instructor Quality Reading Value
Stimulate Interest TA Quality Work Required Recommend Major
Recommend Non-major |
Rated on a scale from 1-5. 1: low, poor, do not recommend. 5: high, great, strongly recommend. |
Section Name |
Name of the course |
Primary Alias |
Full course code |
Penn Course Alert Data
| Field | |
|---|---|
Course |
Course code without section |
Number of Requests |
Number of unique (different students) requests were made for a specific course. These do not count recurring requests, simply whether or not a student ever made a request. |
School |
School the course belongs to based off department |
Results
Demand by Core & Prerequisites
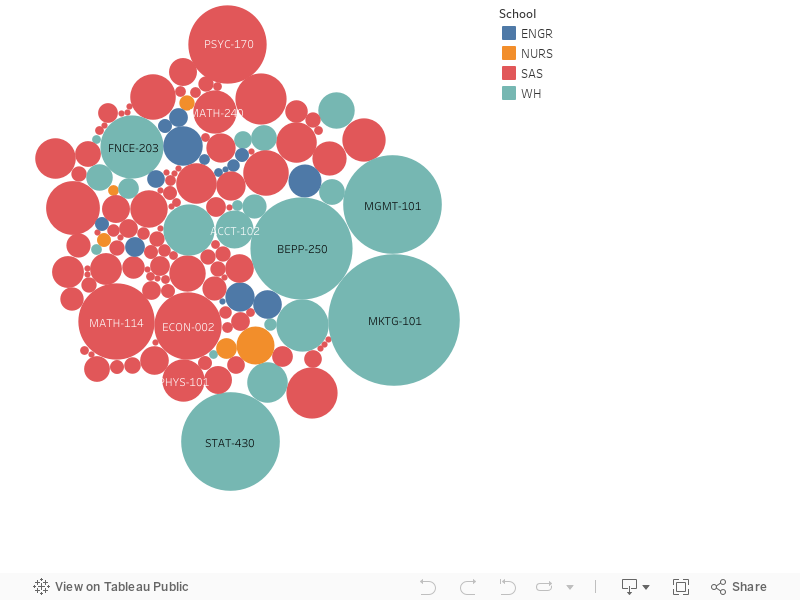
Grouping the courses by school and defining the size by the number of requests made for a specific course
surfaces a common trend across highly demanded courses. Courses like MKTG-101, MGMT-101,
BEPP-250, & MKTG-101 are courses in the core Wharton curriculum. Courses like MATH-114,
ECON-002, & PSYC-170 are introduction and prerequisite courses, required across majors
not only in the college.
During the spring semester, seniors graduating needing to fulfill core requirements or underclassmen (freshmen) looking to take prerequisites
for upper level courses could be the primary users driving the influx of demand. These motives are time sensitive.
⚠️ Recommendation:
When ranking courses for advanced registration, be mindful of core and prerequisite classes and reference this visual to
see which core courses may be more difficult to get into. Since this may also be a time sensitive issue (your academic
schedule would be set back if you didn't get into the course), be sure to rank a core class you want to get into near the top.
Demand by Capacity
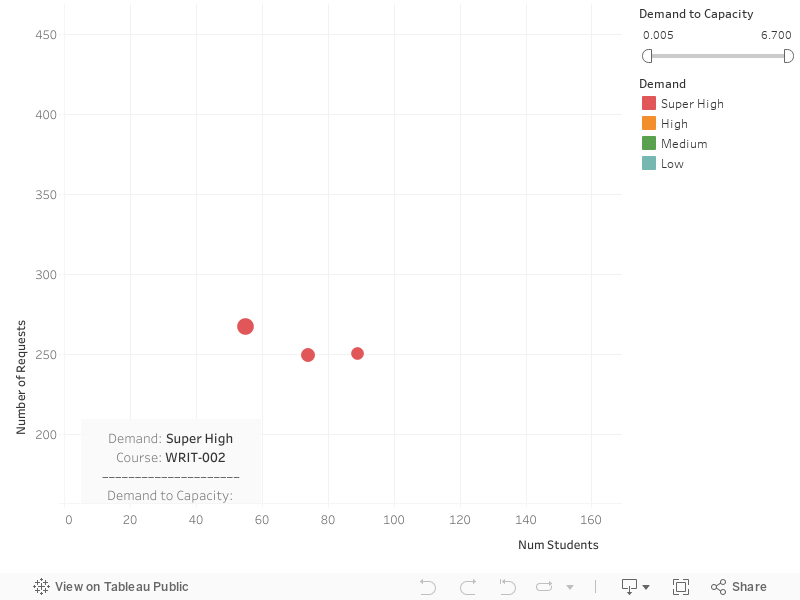
I calculated Demand (d) by taking the ratio of requests to the capacity of the course. Since you can only make requests to get notified if the course is closed, we can already assume that there is exceeding demand for these courses. However, diving into the demand, I created four levels of demand to show the gradient of demand: Low (0.005 ≤ d < 0.5), Medium (0.5 ≤ d < 1), High (1 ≤ d < 3), Super High (3 ≤ d < 4).
The first thing we notice is that most of the requests were made for courses with low capacities, as points
aggregate near the origin. Considering points near the origin, as well as points with large counts of
requests, we notice that those are the higher demanded courses. Once again, we see required classes surfacing
such as WRIT-002, which is Writing Seminar. Its capacity is very low with 10 seats and is in
high demand with 67 students trying to get in.
⚠️ Recommendation:
Be mindful of small courses with low capacities. They are more difficult to get into simply by chance of getting
one of the few seats. When ranking your courses, place smaller classes at the top. This does not include the
size of recitations but specifically regarding the entire course's size.
Demand by Instructor Quality & Difficulty
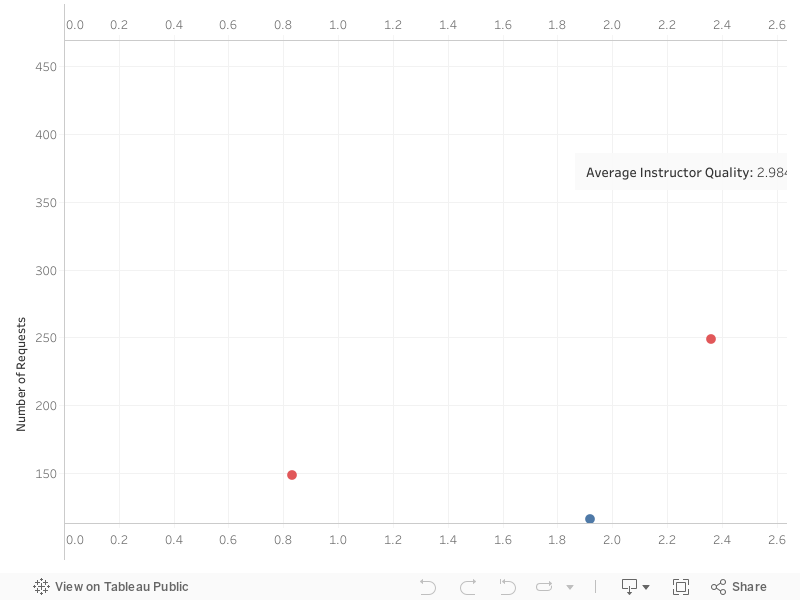
Most courses requested have professors that are above average. In the visual, this is denoted by most of the points aggregating above the average Instructor Quality line. It is sensible that students would want to be taking classes with quality professors. However, I wanted to also add some dimension with students rating professors highly because of course difficulty and their overall experience tainting their accurate assessment of the instructor's quality. Therefore, I added a color dimension that helped group instructors based off the difficulty of their course as well.
The difficulty seems to be dispersed evenly across all instructor qualities. Therefore, we can focus in on the instructor's
quality and note that students tend to make more requests for higher rated professors. We can see here that courses like
MKTG-476/776 surface, which are not prerequisites or core classes but are courses with highly rated professors, in
this case Peter Fader at 3.7.
⚠️ Recommendation:
If the professor is rated highly, the course could have significant demand. However, in comparison to the previous two parameters,
professor quality is not as strong of a driver as course requirement and capacity.
Disclaimers & Looking Forward
The data I used for PCA was the first round of collection since the product was built and released in late fall of 2017 when advanced registration opened. Therefore, the data is not perfect and can only give a rough glimpse at the motives behind course selection at Penn. This data does not account for the same person making recurring requests for one courses since new requests overwrite old requests. Furthermore, I could not account for requests to recitations versus lectures or if students were already in a course but simply wanted to switch sections. However, this type of behavior as well as the simple fact that there are a lot of students that are dissatisfied with their courses and want to get into other courses yields the potential of building products that allow students to swap courses, recitations, lectures and more in order to meet the supply and demands of courses, as students occasionally will need to drop a course to add another.
Me
My name is Tiffany Chang and I am a junior in Wharton studying OIDD & Statistics minoring in Computer Science. I am originally from Honolulu, HI and spend most of my time in product design related activities. On campus, I am involved in the Women's Club Volleyball Team, Hawaii Club and Penn Labs.